 |
| Source |
Via
Barry Ritholtz we find this infographic entitled
Top Performing S&P 500 Stocks showing the best total return over the past 5, 10, 15 and 20 years. Ritholtz sourced it from
Ranked: The Top Performing S&P 500 Stocks in the Last Two Decades By Marcus Lu with graphic design by Miranda Smith.
In each case, Nvidia is the best performing stock, and it is the only stock to appear in all four periods. Sounds great, doesn't it? Why wouldn't you just hold NVDA all the time and be guaranteed to beat the market?
But follow me below the fold for more detail from someone who has been long NVDA for more than three decades..
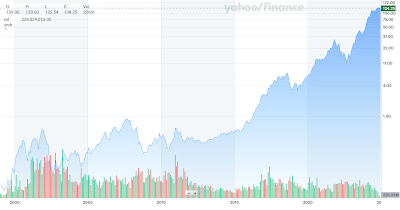
Alas, this infographic is deeply misleading because they cherry-picked their data. Nvidia's stock price is extraordinarily volatile. The log plot of NVDA shows that on average over its history every three years it suffers a drop of between 45% and 80%. Fortunately, over the same time it has had much larger rises. Thus when discussing the return for being long NVDA for a period the start and end dates matter a lot.
| Dec | Close | Dec | Close | NVDA | S&P |
| 2004 | 0.19 | 2009 | 0.38 | +100% | -9.1% |
| 2009 | 0.38 | 2014 | 0.48 | +26% | +85.8% |
| 2014 | 0.48 | 2019 | 5.91 | +1131% | +61.7% |
| 2019 | 5.91 | 2024 | 134.25 | +22715% | +87.6% |
This table shows the performance of NVDA and the S&P 500 over each of the 5-year periods in the infographic. Over three of the 5-year periods NVDA out-performed the S&P 500, and over the remaining one it under-performed. By choosing appropriate starting points it is easy to find other 5-year periods when NVDA under-performed the S&P 500. For example, from 8/2007 to 8/2012 NVDA returned -63.7% but the S&P returned -5.6%. Or from 11/2001 to 11/2006 NVDA returned +10.7% but the S&P returned +23.5%.
Although the infographic suggests that the huge out-performance started 20 years ago and has been decreasing, this is misleading for two reasons. First, the infographic's numbers are for the whole 20-year period, not for each 5-year period. Second, they are dominated by the rise in the most recent 5-year period. The linear plot of NVDA makes it clear that, had the most recent 5-year period been like any of the others, Nvidia would not have been in the infographic at all.
None of this is financial advice. Nevertheless, Nvidia is a great company, and it is possible to make money in its stock. There are two ways to do it, trading on the stock's volatility, or buying low and being prepared to hold it for many years.
Remember, past performance is no guarantee of future performance. If NVDA were to repeat the past 5-year return over the next 5 years, it would be around $3,100. To maintain its current P/E of 52.85 it would need annual revenue of around $2.6T.


No comments:
Post a Comment